Introduction | Expressing | Measurement | Calculations | Graphs | Non-linear relationships | Investigations
Uncertainties in graphs
Error bars
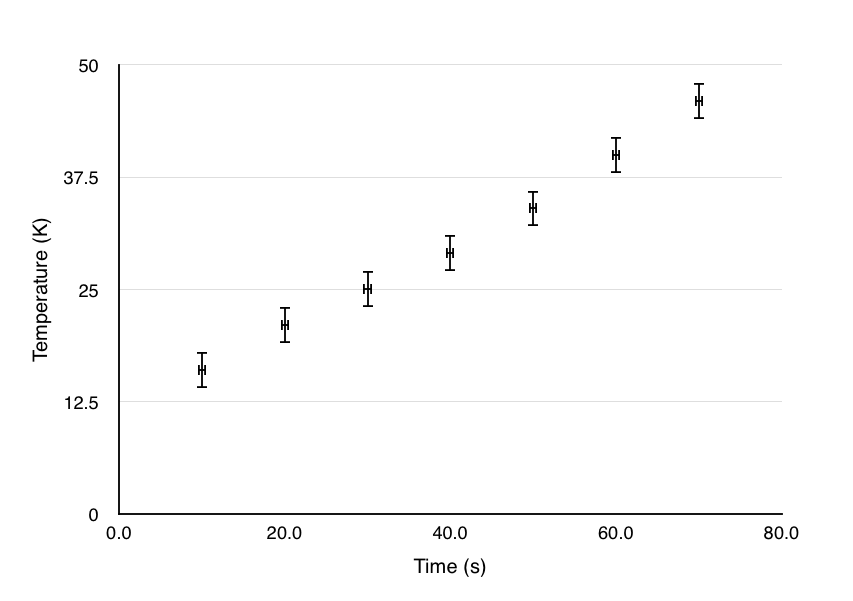
Each data point will have two uncertainties associated with it; an uncertainty from the x value, and an uncertainty from the y value.
Uncertainties are drawn on graphs as error bars, as seen to the right.
For the graph to the right, the error bars for the y value are much larger than those for the x value.
Often the uncertainty in either the x or y value is so small that error bars cannot be properly drawn. In this case the uncertainty in x can be ignored. It is however important to make a note in your report if you do this.
Error lines
To find the gradient of our data and its uncertainty, we need to draw two lines.
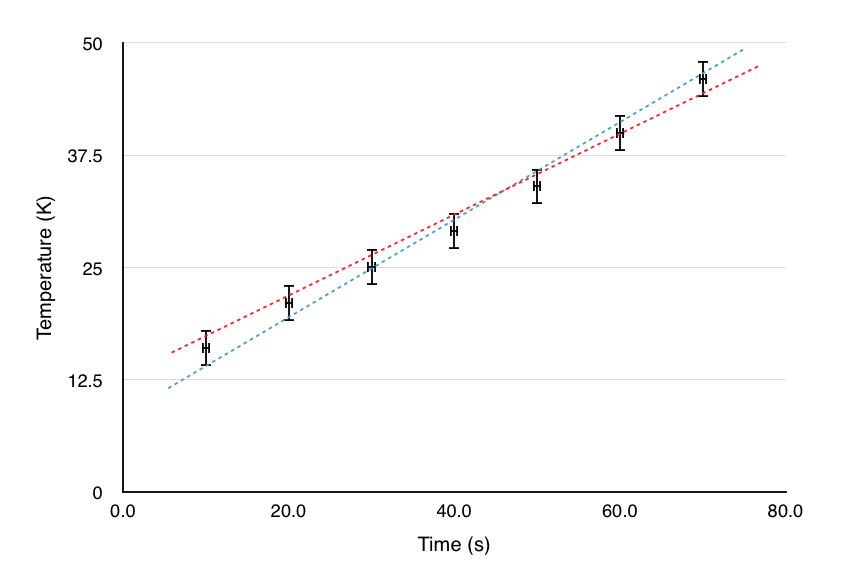
The blue line represents the maximum (steepest) possible gradient, and the red line represents the minimum (gentlest) possible gradient. Both of these lines should pass through all of the error bars on the graph.
The value for the final gradient will be the average of the maximum and minimum gradients.
Final gradient = ½ (maximum gradient + minimum gradient)
The uncertainty will be half the difference between the maximum and minimum gradients.
Final gradient uncertainty = ½ (maximum gradient - minimum gradient)
How NOT to find the gradient
You must use the above method to find the gradient with uncertainty. A common incorrect method I've seen used is as follows:
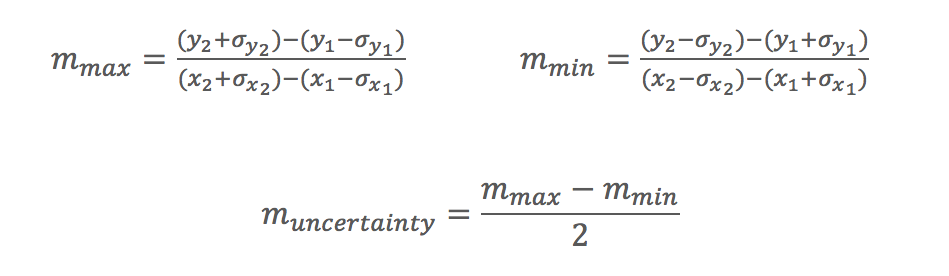
The problem with this method is that it only uses two points, and ignores all the points in between. If the first or second point is an outlier, this will significantly compromise your data.
Do not use this method.
Appendix: calculating the gradient of a line
- Choose two points on the line you wish to calculate the gradient of. Do not use data points!
- The gradient will be the difference on the y axis, divided by the difference on the x axis (think "rise over run")
Gradient = ∆y / ∆x
